Spark Execution
Let me start our topic with this question “have you ever wondered how your spark jobs executed and jobs are segregated into stages?”.In this article i’m going to talk about spark execution and more about spark execution stages.
Spark engine does following two steps
- Logical Execution Plan/Logical Plan
- Physical Execution Plan/Execution Plan
Logical Plan
As far as RDDs are concerned, transformations are lazily evaluated as we already knew but what exactly happens when you trigger a transformation on an RDD? Well, a logical execution plan would be prepared and you can check it programatically by toDebugString().This gives you the info about its parent and its parent and so on.
   val data = for {
      key <- 1 to 300
      value <- 1 to 20
    } yield (key, value)

   val baseRDD = sc.parallelize(data) groupByKey()
   println(baseRDD.toDebugString)
Result
(2) ShuffledRDD[1] at groupByKey at Main.scala:21 []

 +-(2) ParallelCollectionRDD[0] at parallelize at Main.scala:21 []
You can get information by toDebugString() even before triggering any action operation.This gives information about RDDs and its affinities.Another option (mostly ppl use) is directed acyclic graph (DAG) that you can find on Spark UI once the job is materialised (triggered an action on RDD). Both gives you almost the same information but in different format.

This is also referred as lineage/meta which gives idea to the spark engine saying that how the datasets are derived and its affinity which will be helpful during re-computation of data in case of node failure and other such scenarios.This is called logical plan which is a step one in execution.You have to remember that so far no data movement happened in this step.Interestingly,The spark scheduler will truncate the lineage of a RDD’s parent once you persisted the child RDD.
Let say rdd1.rdd2.rdd3.cache(). In this case, Spark scheduler will truncate the lineage of rdd1 and rdd2 from rdd3. This says that, the moment you cache, Spark will treat the cached RDD (rdd3) as its entry point.
Physical Execution Plan
This is the second phase of the job execution but this will be initiated only as part of an action.Meaning this phase will take place only when you call action (like count()) on your RDD.The physical plane will be prepared based on DAG and will be sent to scheduler.The physical plan will include detailed information about job’s stages and each stage’s tasks.
This is the second phase of the job execution but this will be initiated only as part of an action.Meaning this phase will take place only when you call action (like count()) on your RDD.The physical plane will be prepared based on DAG and will be sent to scheduler.The physical plan will include detailed information about job’s stages and each stage’s tasks.
Stages????? yes stages. In general ,Spark splits a job into stages (sub tasks) and these stages will be executed in an order.Each stage will have internal tasks which acts across the partitions.You might have noticed the result of toDebugString() and it says (2).does it mean each RDD is a stage?.Not really and let's see why with an example.
val data = for {
      key <- 1 to 300
      value <- 1 to 20
    } yield (key, value)

val baseRDD = sc.parallelize(data).reduceByKey((acc, curr) => curr + 1)
 .groupByKey()

println(baseRDD.toDebugString)
Result
 (2) MapPartitionsRDD[2] at groupByKey at Main.scala:21 []
 |  ShuffledRDD[1] at reduceByKey at Main.scala:21 []
 +-(2) ParallelCollectionRDD[0] at parallelize at Main.scala:21 []
You can see it from above result that still it says 2 stages but in the contrary we have 3 RDDs.So its clear that stages are not defined by just number of RDDs we have in our jobs.Then what defines stages? well Its called Pipelining.Pipelining is the process of collapsing of multiple RDDs into a single stage when a RDD can be computed from their parents without any data movement (shuffling).
Let's go back to our example to understand it better.
sc.parallelize(data).reduceByKey((acc, curr) => curr + 1) .groupByKey() is equivalent to
val rdd1 =sc.parallelize(data)
val rdd2 = rdd1.reduceByKey((acc, curr) => curr + 1)
val rdd3 =rdd2.groupByKey()
Totally we produced 3 RDDs in which rdd1 is a ParallelCollectionRDD that we produced when we parallelize a set of Tuples.In this step obviously we have data movement. rdd2 is a result of reduceByKey() which is a wide operation and it had data movement.Finally groupByKey() is also a wide operation whereas it’s parent rdd2 is hash-partitioned so no data movement happened on this step so it is pipeline into stage 2.so toDebugString() also hints us number of stages? the answer is no. Because it just shows logical plan but stages are all about physical plan.lets see this more in detail.
sc.parallelize(data).reduceByKey((acc, curr) => curr + 1)
.groupByKey().repartition(2)
Result
(2) MapPartitionsRDD[6] at repartition at Main.scala:21 []
 |  CoalescedRDD[5] at repartition at Main.scala:21 []
 |  ShuffledRDD[4] at repartition at Main.scala:21 []
 +-(2) MapPartitionsRDD[3] at repartition at Main.scala:21 []
    |  MapPartitionsRDD[2] at groupByKey at Main.scala:21 []
    |  ShuffledRDD[1] at reduceByKey at Main.scala:21 []
    +-(2) ParallelCollectionRDD[0] at parallelize at Main.scala:21 []
As you know, repartition() will trigger data movement but still the toDebugString() shows 2. It is clear that toDebugString() is only for getting RDDs lineage/affinity information.But when it comes to stages, this is not the right place to look in the detail. You should look into Spark UI’s Stage page.

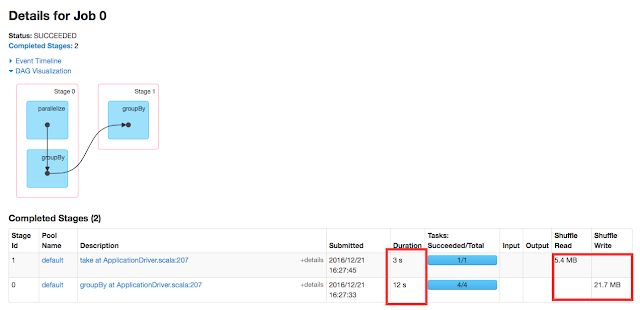
The UI shows the above job was executed in three stages.So its clear that how stages are determined and how pipelining are playing the role in defining the stages.These all are part of physical plan.Once the plane is ready, it will be sent to scheduler and the scheduler will submit the job to the executers and the job will be materialised and result will be sent back to the drive programs.
Conclusion
In this topic, we have covered about Spark Jobs and its execution plans.We saw about DAG and how it is covered into physical plane.We also saw what are stages and how pipelining are defining stages.
Comments
Post a Comment